Ever wanted to find out how users are engaging with your Confluence pages? Thanks to Confluence analytics, you can do just that.
You've worked hard creating new pages for a
Confluence space - now what? Thanks to Confluence’s built-in analytics, there's no need to be in the dark about whether your team is engaging with your content.
In this blog, we’ll discuss how to know exactly what you can expect from Confluence analytics.
What are analytics in Confluence?
Confluence analytics is a powerful tool that lets you track and analyse metrics related to collaboration and content creation. It provides actionable insights into how teams are using Confluence so that ultimately, you can create better, more engaging pages.
Where to find the analytics dashboard in Confluence Cloud
Please note: To use the Confluence analytics dashboard, you’ll need a Premium or Enterprise account.
- Click 'Apps' in the top Confluence toolbar.
- In the dropdown menu, select 'Analytics'.
You'll be taken to the analytics reporting page, which shows you how users are viewing and engaging with your content.
Is Confluence analytics available to all Confluence users?
Confluence analytics is only available on Confluence Cloud Premium and Enterprise tiers. Depending on your administrator rights, you may also not be able to access analytics - if you can’t find the analytics page, contact your Confluence admin to confirm this.
How to view Confluence analytics on a Standard plan
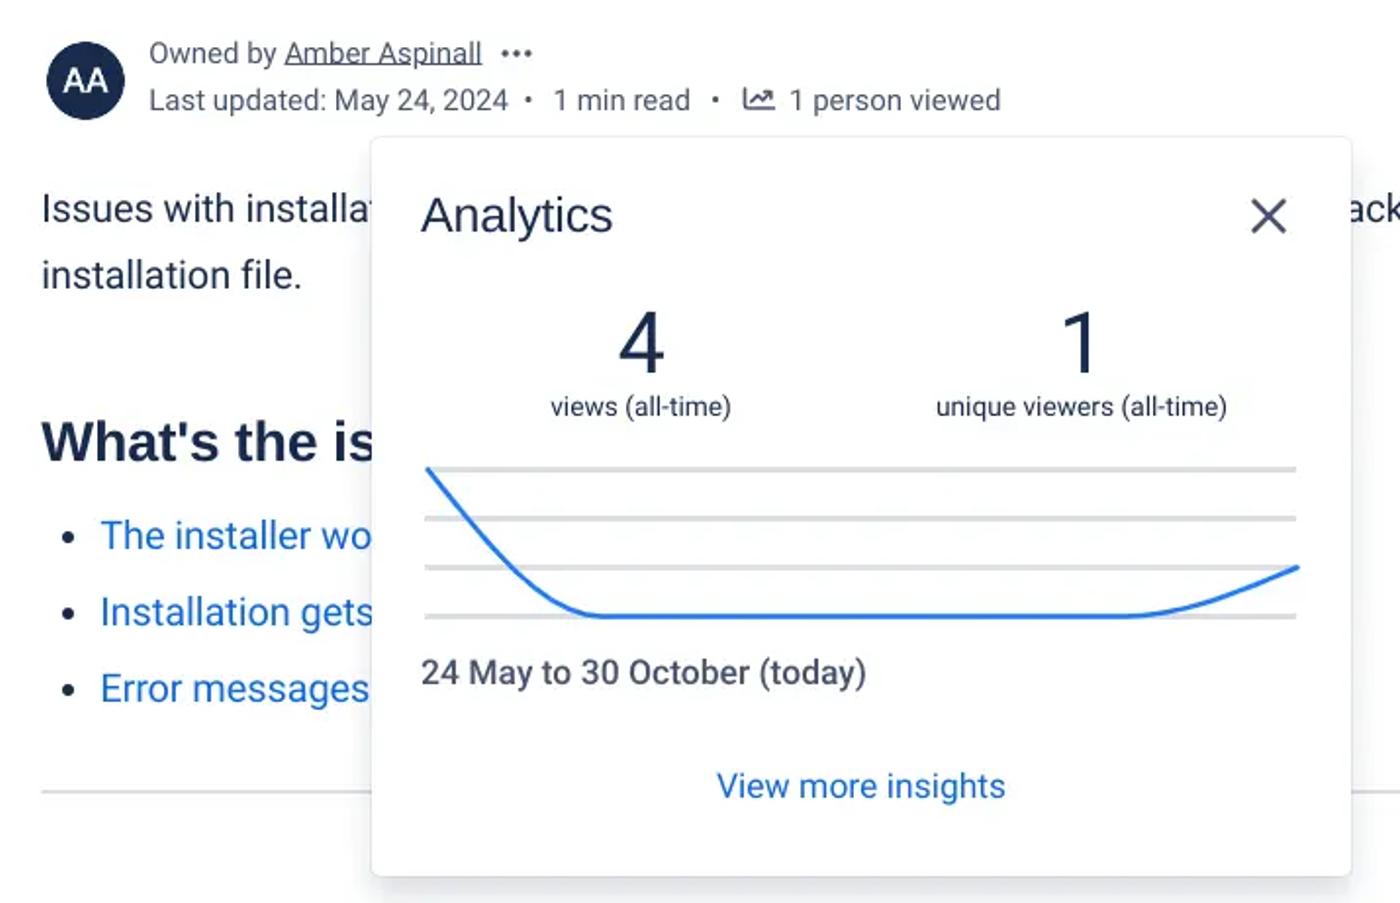
Though Standard users can’t access the analytics dashboard, you can view analytics for individual pages. Simply go to a Confluence page of your choice, then click on 'x person/people viewed' under the page title.
From here, you get an at-a-glance view of your page’s views in the past seven days.
To look at views and viewers over a longer period, just click 'View more insights'.
What insights can you gain from Confluence’s analytics dashboard?
The Overview tab provides a snapshot of user engagement in Confluence.
At the top of the Overview is a graph displaying the number of views, pages created, pages updated, and searches within your Confluence instance during a specific time period. You can filter by different date ranges and change what data the chart shows. For example, engagement across pages instead of spaces.
Within Confluence’s reporting, there are three other tabs that let you explore the data in a variety of ways:
- Spaces: Discover the spaces with the most views, as well as the most active spaces for content creation. You can even dig into specific spaces to learn which pages are the most popular.
- Users: Compare user searches, comments, views, and created pages to understand who the most engaged team members are.
- Search: View popular and trending search terms for your Confluence instance, as well as the most clicked content and spaces for specific terms.
Get the most out of Confluence analytics: three tips
Here are three ways you can leverage Confluence’s User, Page, and Space data to your advantage:
- Identify key metrics: Start by determining the specific metrics that are most relevant to your team's goals and workflows. Whether it's tracking page views, user engagement, or content creation rates, pinpointing the most useful data will save you a lot of time.
- Use filters: Take advantage of Confluence’s filtering and segmentation capabilities to focus on the data that matters most. For example, if you only need to focus on last month’s data, you can exclude the months before that. You can narrow down your reports by date range, particular spaces, and even content types to gain deeper insights into specific areas of interest.
- Export for custom insights: If you really want to dig into your Confluence usage or share insights with the team, you can export your data as a spreadsheet. This option is available on the Space and User tabs of the Analytics page - just click the three dots (...) at the top-right of the page and select 'Export Excel'.
Your Confluence pages, but better
Give your Confluence pages the love they deserve. Discover Mosaic today and start building pages that users care about.


